Best Practices
SafeSky UAV API - Integration Guide
This guide provides architectural patterns and best practices for integrating the SafeSky UAV API into mission control software, moving-map applications, and operational dashboards.
Overview
The SafeSky API enables developers to build production-grade air traffic awareness systems that display real-time positions of UAVs, helicopters, recreational aviation, general aviation aircraft, and commercial traffic.
This guide addresses the technical challenges of building responsive, scalable traffic layers that meet operational aviation standards.
Reference Implementation: https://live.safesky.app
Key Design Goals
- Real-time traffic awareness with minimal latency
- Smooth, professional rendering on dynamic maps
- Efficient resource utilization for fleet operations
- Compliance with aviation best practices
1. Integration Architecture
Dual-Thread Pattern
Implement traffic retrieval and telemetry publishing as independent, asynchronous processes. This separation is critical for operational reliability.
┌─────────────────────┐      ┌─────────────────────┐
│  Traffic Retrieval  │      │   UAV Telemetry     │
│      Thread         │      │  Publisher Thread   │
├─────────────────────┤      ├─────────────────────┤
│ GET /v1/uav         │      │ POST /v1/uav        │
│ Viewport queries    │      │ Position updates    │
│ 3-second polling    │      │ 1Hz transmission    │
└─────────────────────┘      └─────────────────────┘
         ↓                            ↓
    ┌────────────────────────────────────┐
    │      Application State/Map         │
    └────────────────────────────────────┘
Architectural Benefits:
- Fault isolation: Network issues in one thread don't cascade to the other
- Independent scaling: Adjust polling and publishing rates separately
- Simplified error handling: Each thread manages its own retry logic
- Resource optimization: Non-blocking I/O prevents thread starvation
Implementation Note: In single-threaded environments (e.g., JavaScript), use separate async tasks or workers to achieve the same isolation.
2. Traffic Retrieval Strategy
Viewport-Based Queries
For map-based applications, use bounding box queries that align with the visible viewport:
GET /v1/uav?viewport=lat_min,lng_min,lat_max,lng_max
Example:
GET /v1/uav?viewport=48.8566,2.3522,48.8766,2.3922
Technical Advantages of Viewport Query vs Radius Query:
| Aspect | Viewport Query | Radius Query |
|---|---|---|
| Zoom adaptability | Natural scaling with map bounds | Fixed circular area |
| Data efficiency | Fetches only visible region | Often includes off-screen data |
| Rendering alignment | 1:1 with visible area | Requires post-filtering |
| Edge cases | Handles rectangular screens correctly | Circular overlap issues |
Viewport Padding (Overscan)
Extend query bounds 5-15% beyond the visible viewport to improve UX and anticipate edge transitions.
Implementation Example:
const OVERSCAN_FACTOR = 0.10; // 10% padding

function getQueryViewport(mapBounds) {
  const latPadding = (mapBounds.north - mapBounds.south) * OVERSCAN_FACTOR;
  const lngPadding = (mapBounds.east - mapBounds.west) * OVERSCAN_FACTOR;

  return {
    lat_min: mapBounds.south - latPadding,
    lng_min: mapBounds.west - lngPadding,
    lat_max: mapBounds.north + latPadding,
    lng_max: mapBounds.east + lngPadding
  };
}
Benefits:
- Eliminates visual "pop-in" during map panning
- Pre-loads aircraft approaching screen edges
- Smooths fast-moving traffic transitions (e.g., aircraft at 200+ knots)
- Minimal bandwidth overhead (typically <10% additional data)
Polling Frequency
Recommended interval: 3 seconds
This frequency balances real-time awareness with bandwidth efficiency.
Rationale:
- Aircraft moving at 100 knots travel ~150 meters in 3 seconds
- 3-second updates provide adequate situational awareness while reducing server load
- Reduces bandwidth consumption by 66% compared to 1-second polling
- Client-side extrapolation maintains smooth visual rendering between updates
- Acceptable load for both mobile and web clients with lower data usage
Network Optimization:
- Consider compression (gzip) for responses
3. Understanding Traffic Types
The SafeSky API returns two distinct types of UAV traffic, each with different data models and display requirements.
Live Traffic vs. Advisory Traffic
ADS-B, FLARM, ADS-L, or custom
ADVISORY
Position Accuracy
High (GPS-based)
Low (area indicator)
Live Traffic Response Model
Live traffic represents UAVs and aircraft transmitting real-time position data:
{
  "id": "UAV123",
  "latitude": 48.86584,
  "longitude": 2.63723,
  "beacon_type": "UAV",
  "call_sign": "FlyingFrog",
  "transponder_type": "ADS-B",
  "last_update": 1733412793,
  "altitude": 180,
  "course": 250,
  "ground_speed": 24,
  "status": "AIRBORNE",
  "accuracy": 10
}
Key Fields:
latitude and longitude coordinates
Real-time motion data: ground_speed, course, vertical_rate
High position accuracy (typically <100m)
Status: AIRBORNE, GROUNDED, or INACTIVE
Advisory Traffic Response Model
Advisory traffic represents declared UAV operation areas without live telemetry:
{
  "id": "hx-137105",
  "latitude": 63.41303,
  "longitude": 10.11205,
  "beacon_type": "UAV",
  "call_sign": "HWX137105",
  "transponder_type": "ADVISORY",
  "last_update": 1766068287,
  "altitude": 231,
  "accuracy": 1852,
  "course": 0,
  "ground_speed": 0,
  "status": "AIRBORNE"
}
Key Distinguishing Features:
transponder_type: "ADVISORY" identifies advisory traffic
Large accuracy value (typically 500-2000m) represents the operational radius
latitude/longitude indicate the center point of the advisory area
ground_speed and course are typically 0 (no live telemetry)
altitude represents maximum operational altitude
Important: The accuracy field for advisory traffic represents the radius of the operational area, not GPS precision.
Display Recommendations
Displaying Live Traffic
Live traffic should be rendered as precise point symbols with real-time updates:
Visual representation:
• Icon: Aircraft/UAV symbol oriented by course heading
• Position: Exact lat/lng coordinates
• Animation: Smooth extrapolation between updates
• Label: Show call_sign, altitude, and ground_speed
• Color: Solid, distinct color by beacon_type
Implementation:
course
Display motion vector or heading indicator
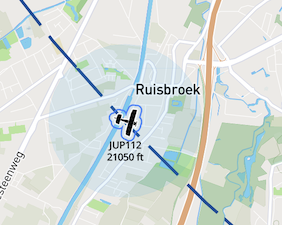
Displaying Advisory Traffic
Advisory traffic should be rendered as area indicators rather than precise points:
Visual representation:
• Shape: Circular area or polygon (if geometry available)
• Radius: Use the accuracy field value (in meters)
• Style: Semi-transparent fill with distinct border
• Label: Show call_sign and max_altitude
• Icon: Optional center marker (static, no heading)
• Color: Distinct from live traffic (e.g., amber/yellow)
Implementation Example:
function renderAdvisoryTraffic(traffic) {
  if (traffic.transponder_type === 'ADVISORY') {
    // Render as circular area
    const circle = new Circle({
      center: [traffic.longitude, traffic.latitude],
      radius: traffic.accuracy, // meters
      fill: 'rgba(255, 165, 0, 0.2)', // Semi-transparent orange
      stroke: 'rgb(255, 140, 0)',
      strokeWidth: 2
    });

    // Add center marker (optional)
    const marker = new Marker({
      position: [traffic.longitude, traffic.latitude],
      icon: 'advisory-icon',
      label: `${traffic.call_sign}\nMax Alt: ${traffic.altitude}m`
    });

    return [circle, marker];
  }
}
Visual Distinction is Critical:
User Experience Guidelines:
Example: Mixed Traffic Response
A typical API response may contain both types:
[
  {
    "id": "3423C3",
    "latitude": 48.86584,
    "longitude": 2.63723,
    "beacon_type": "JET",
    "transponder_type": "ADS-B",
    "call_sign": "IBE06CK",
    "last_update": 1733412793,
    "altitude": 10554,
    "ground_speed": 237,
    "course": 205,
    "accuracy": 10,
    "status": "AIRBORNE"
  },
  {
    "id": "hx-137105",
    "latitude": 63.41303,
    "longitude": 10.11205,
    "beacon_type": "UAV",
    "transponder_type": "ADVISORY",
    "call_sign": "HWX137105",
    "last_update": 1766068287,
    "altitude": 231,
    "accuracy": 1852,
    "ground_speed": 0,
    "course": 0,
    "status": "AIRBORNE"
  }
]
Filtering Strategy:
function categorizeTraffic(trafficArray) {
  const live = trafficArray.filter(t => t.transponder_type !== 'ADVISORY');
  const advisory = trafficArray.filter(t => t.transponder_type === 'ADVISORY');

  return { live, advisory };
}
4. UAV Telemetry Publishing
Endpoint
POST /v1/uav
Content-Type: application/json
Publishing Frequency: 1 second (1Hz)
Batch Publishing for Fleet Operations
When managing multiple UAVs, always use batch publishing by sending an array of telemetry objects in a single request.
Performance Comparison:
| Approach | UAVs | Requests/sec | HTTP Overhead | Network Latency |
|---|---|---|---|---|
| Individual | 10 | 10 | ~4KB | 10× RTT |
| Batch | 10 | 1 | ~400B | 1× RTT |
Key Benefits:
- Reduced overhead: Single HTTP handshake vs. multiple connections
- Lower latency: One round-trip instead of N round-trips
- Improved scalability: Essential for swarm operations (20+ UAVs)
Best Practice: Aggregate telemetry in your application loop and publish the entire fleet state atomically.
Example: Batch UAV Publish Payload
[
  {
    "id": "UAV1",
    "latitude": 48.86584,
    "longitude": 2.63723,
    "altitude": 120,
    "course": 205,
    "ground_speed": 12,
    "status": "AIRBORNE",
    "last_update": 1733412793
  },
  {
    "id": "UAV2",
    "latitude": 48.87012,
    "longitude": 2.64188,
    "altitude": 115,
    "course": 210,
    "ground_speed": 10,
    "status": "AIRBORNE",
    "last_update": 1733412793
  }
]
4.5. Pre-Flight Visibility
GROUNDED Status Broadcasting
Publish UAV position with status: "GROUNDED" 3-5 minutes before takeoff.
{
  "id": "UAV1",
  "latitude": 48.86584,
  "longitude": 2.63723,
  "altitude": 0,
  "status": "GROUNDED",
  "last_update": 1734537600
}
Operational Rationale:
- Provides advanced notification to nearby crewed aircraft and helicopters
- Establishes situational awareness before airspace usage
- Aligns with aviation practice of pre-flight intent signaling
- Particularly important near helipads, airports, or low-altitude flight zones
State Transition:
Transition to status: "AIRBORNE" immediately upon takeoff to reflect actual flight status.
Implementation Note: For mission planning applications, this can be automated based on pre-filed flight plans or launch schedules.
5.6. Smooth Motion Rendering
Client-Side Position Extrapolation
Traffic updates arrive at discrete 3-second intervals. To achieve smooth animation, implement dead reckoning between updates.
Algorithm:
function extrapolatePosition(aircraft, currentTime) {
  const elapsedSeconds = (currentTime - aircraft.last_update) / 1000;
  const distanceMeters = aircraft.ground_speed * 0.514444 * elapsedSeconds; // knots to m/s

  const deltaLat = distanceMeters * Math.cos(aircraft.course * Math.PI / 180) / 111320;
  const deltaLng = distanceMeters * Math.sin(aircraft.course * Math.PI / 180) /
                   (111320 * Math.cos(aircraft.latitude * Math.PI / 180));

  return {
    latitude: aircraft.latitude + deltaLat,
    longitude: aircraft.longitude + deltaLng
  };
}
Rendering Impact:
- Transforms discrete position updates into fluid 60fps animation
- Eliminates visual "jumping" or "teleporting" artifacts
- Creates professional, aviation-grade map presentation
- Improves user perception of traffic flow patterns
Limitation: Extrapolation assumes constant velocity and heading. Maneuvering aircraft may show brief position discrepancies until the next update.
6.7. Traffic Aging and Expiry
Data Freshness Management
Different traffic sources have different validity windows based on their update characteristics.
Advisory UAV Traffic
- Validity: Up to 2 minutes after last update
- Rationale: Lower speed and predictable flight patterns
- Display: Apply visual indicators for aged data (reduced opacity, uncertainty ring)
Real-Time Air Traffic (ADS-B, FLARM, ADS-L)
| Age | State | Visualization |
|---|---|---|
| 0-30s | Current | Full opacity, normal icon |
| 30-45s | Stale | Reduced opacity + expanding uncertainty circle |
| >45s | Expired | Remove from display |
Uncertainty Visualization
Implementation Approach:
function getUncertaintyRadius(lastUpdate, currentTime, groundSpeed) {
  const ageSeconds = (currentTime - lastUpdate) / 1000;
  if (ageSeconds < 30) return 0;

  // Assume maximum maneuvering potential
  const maxDistanceMeters = groundSpeed * 0.514444 * ageSeconds;
  return maxDistanceMeters; // Display as circle radius
}
Purpose: Prevents false precision in position estimates. Users see explicit uncertainty rather than misleading "current" positions.
Visual Design: Use semi-transparent expanding circles that grow linearly with time since last update.
7.8. Visual Design Guidelines
Traffic Icon States
Implement progressive visual feedback to communicate data confidence:
Data Freshness States:
┌─────────────┬──────────────┬────────────────┬──────────────┐
│   Current   │     Aging    │  Uncertain     │   Expired    │
│   (0-30s)   │   (30-45s)   │                │    (>45s)    │
├─────────────┼──────────────┼────────────────┼──────────────┤
│ Solid icon  │ 70% opacity  │ + uncertainty  │ Remove from  │
│ Full color  │ Subtle pulse │   circle       │   display    │
└─────────────┴──────────────┴────────────────┴──────────────┘
Traffic Categorization
Use distinct iconography for different aircraft types:
- UAV/Drone: Quadcopter or fixed-wing silhouette
- Helicopter: Rotor-based icon with rotation indicator
- General Aviation: Small aircraft silhouette
- Commercial: Larger aircraft profile
- Unknown: Generic aircraft symbol
Accessibility Note: Ensure icons are distinguishable by shape, not just color, for colorblind users.
8.9. Icon Assets
SafeSky provides optimized icon sets for rapid integration.
Download: aircraft.zip
Package Contents:
- Formats: SVG (vector) and PNG (raster)
- Sizes: 24×24, 32×32, 48×48, 64×64 px
- Themes: Light and dark mode variants
- Categories: UAV, helicopter, GA, commercial, glider, balloon
Usage Recommendations:
- Use SVG for web applications (resolution independence, smaller payload)
- Use PNG for native applications with fixed DPI requirements
- Implement theme switching based on map style (dark maps = light icons)
9.10. Configuration Reference
Timing Parameters
| Parameter | Value | Rationale |
|---|---|---|
| GET traffic (viewport) | 3 seconds | Optimal balance of real-time awareness and bandwidth efficiency |
| POST UAV telemetry | 1 second | Maintains continuity for receiving applications |
| Pre-flight GROUNDED publish | 3–5 min before takeoff | Provides advanced notice to nearby traffic |
| Uncertainty visualization | 30 seconds after update | Reflects realistic position drift |
| Traffic expiry (non-UAV) | 45 seconds after update | Prevents stale data display |
| UAV expiry | 2 minutes after update | Accommodates lower-frequency updates |
| Viewport overscan | 10-15% | Eliminates edge transition artifacts |
10.11. Reference Implementation
Explore a production implementation of these patterns:
Live Demo: https://live.safesky.app
The reference implementation demonstrates:
- Dual-thread architecture with independent polling and publishing
- Viewport-based queries with dynamic overscan
- Client-side position extrapolation for smooth rendering
- Progressive data aging with uncertainty visualization
- Batch telemetry publishing for fleet operations
Use the browser developer tools to observe network traffic patterns, polling behavior, and rendering optimizations in a production environment.